
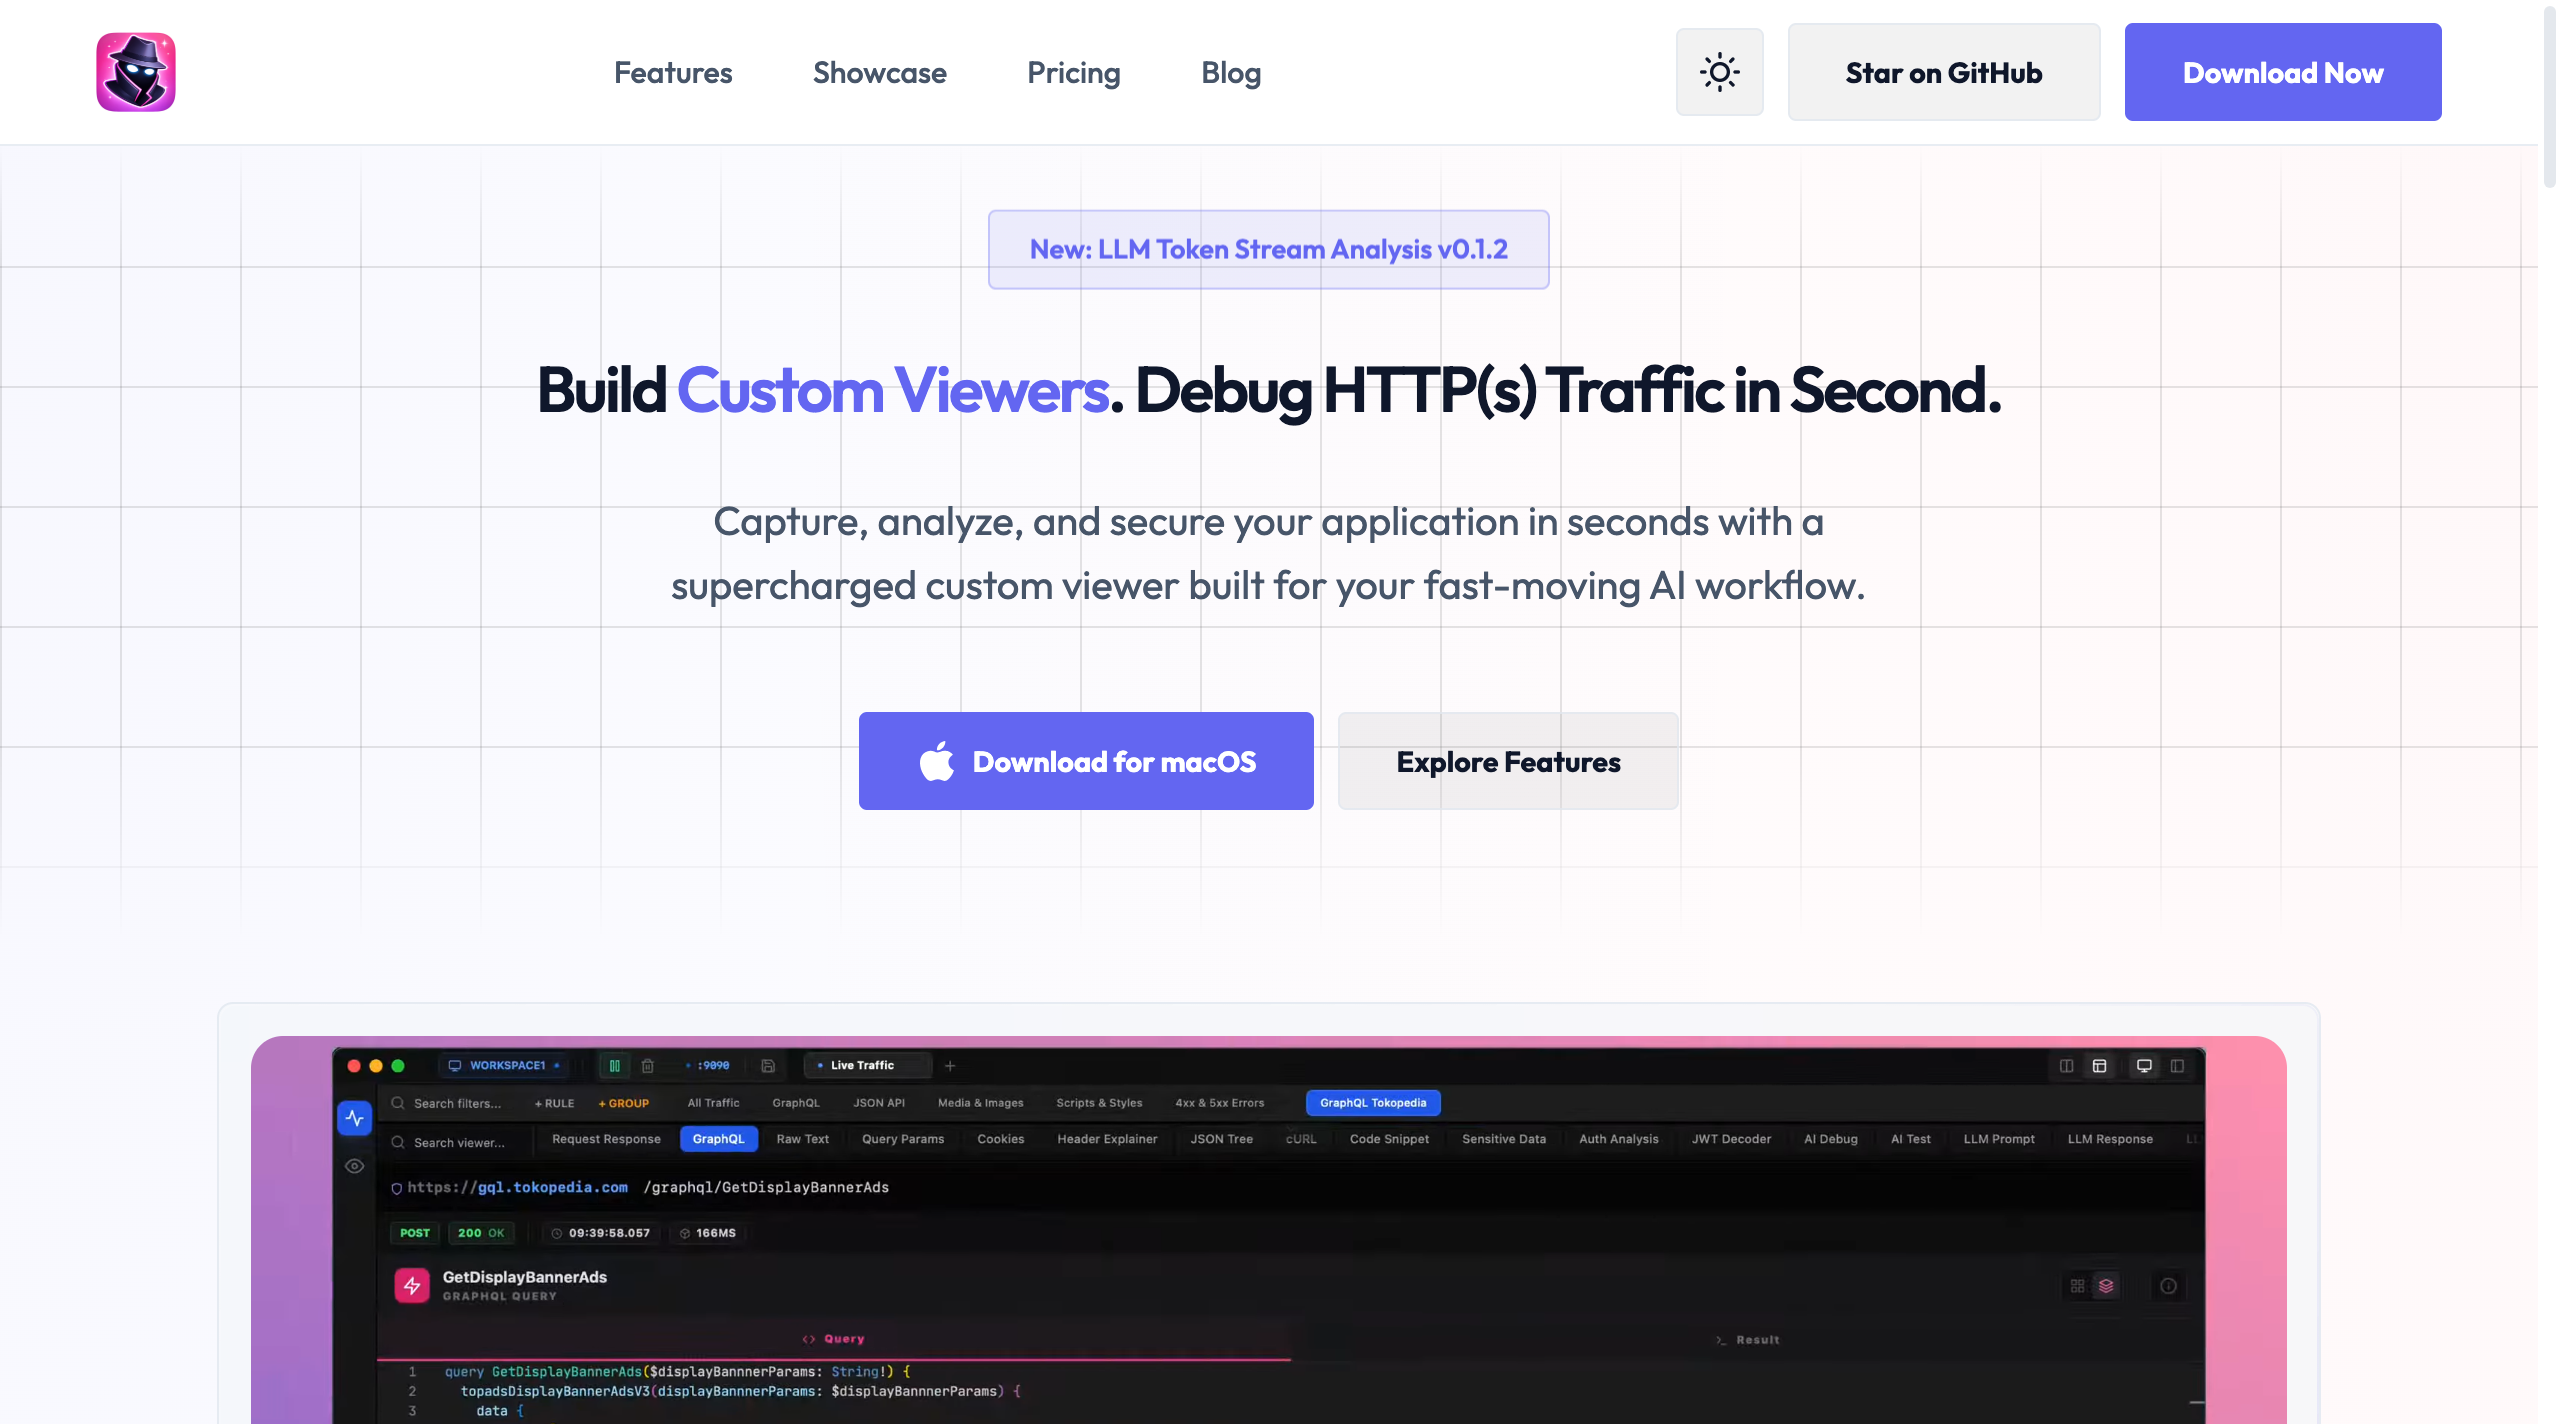
Every developer debugging an API has been there. You fire a request, something breaks, and you have no idea what actually went over the wire. You add console logs. You guess. You add more logs. For simple REST calls this is annoying. For GraphQL, streaming responses, and AI applications sending tokens chunk by chunk, it becomes genuinely painful. NetworkSpy It sits between your application and the network and shows you everything. Every request, every response, every header, every payload, every timing detail. HTTPS traffic is intercepted and decrypted automatically with zero configuration. You do not set up certificates manually. You do not fight with trust settings. You just open it and start seeing traffic. The comparison engine lets you diff any two requests side by side so you can catch subtle regressions the moment they appear. The replay engine lets you modify a captured request and re-emit it instantly without rebuilding anything. Live breakpoints let you pause real traffic and alter payloads before they reach your client or server. For teams building AI applications there is a dedicated LLM token stream analyzer. It intercepts streaming responses in real time, tracks token usage, and maps latency distribution for every chunk. If your AI app is slow, misbehaving, or sending unexpected tokens, you will see exactly where and why. GraphQL gets its own intelligence layer with schema-aware inspection that parses deeply nested queries, mutations, and fragments properly instead of dumping raw JSON at you. The MCP bridge connects your traffic logs directly to AI agents so your agents can reason about what is happening on your network in real time. There is also a custom viewer engine so you can build your own visualizers for proprietary data formats, and OWASP security auditing that surfaces API vulnerabilities like IDOR and mass assignment as they happen. Open source, MIT licensed, and actively maintained. The network debugger that keeps up with how modern applications actually work.